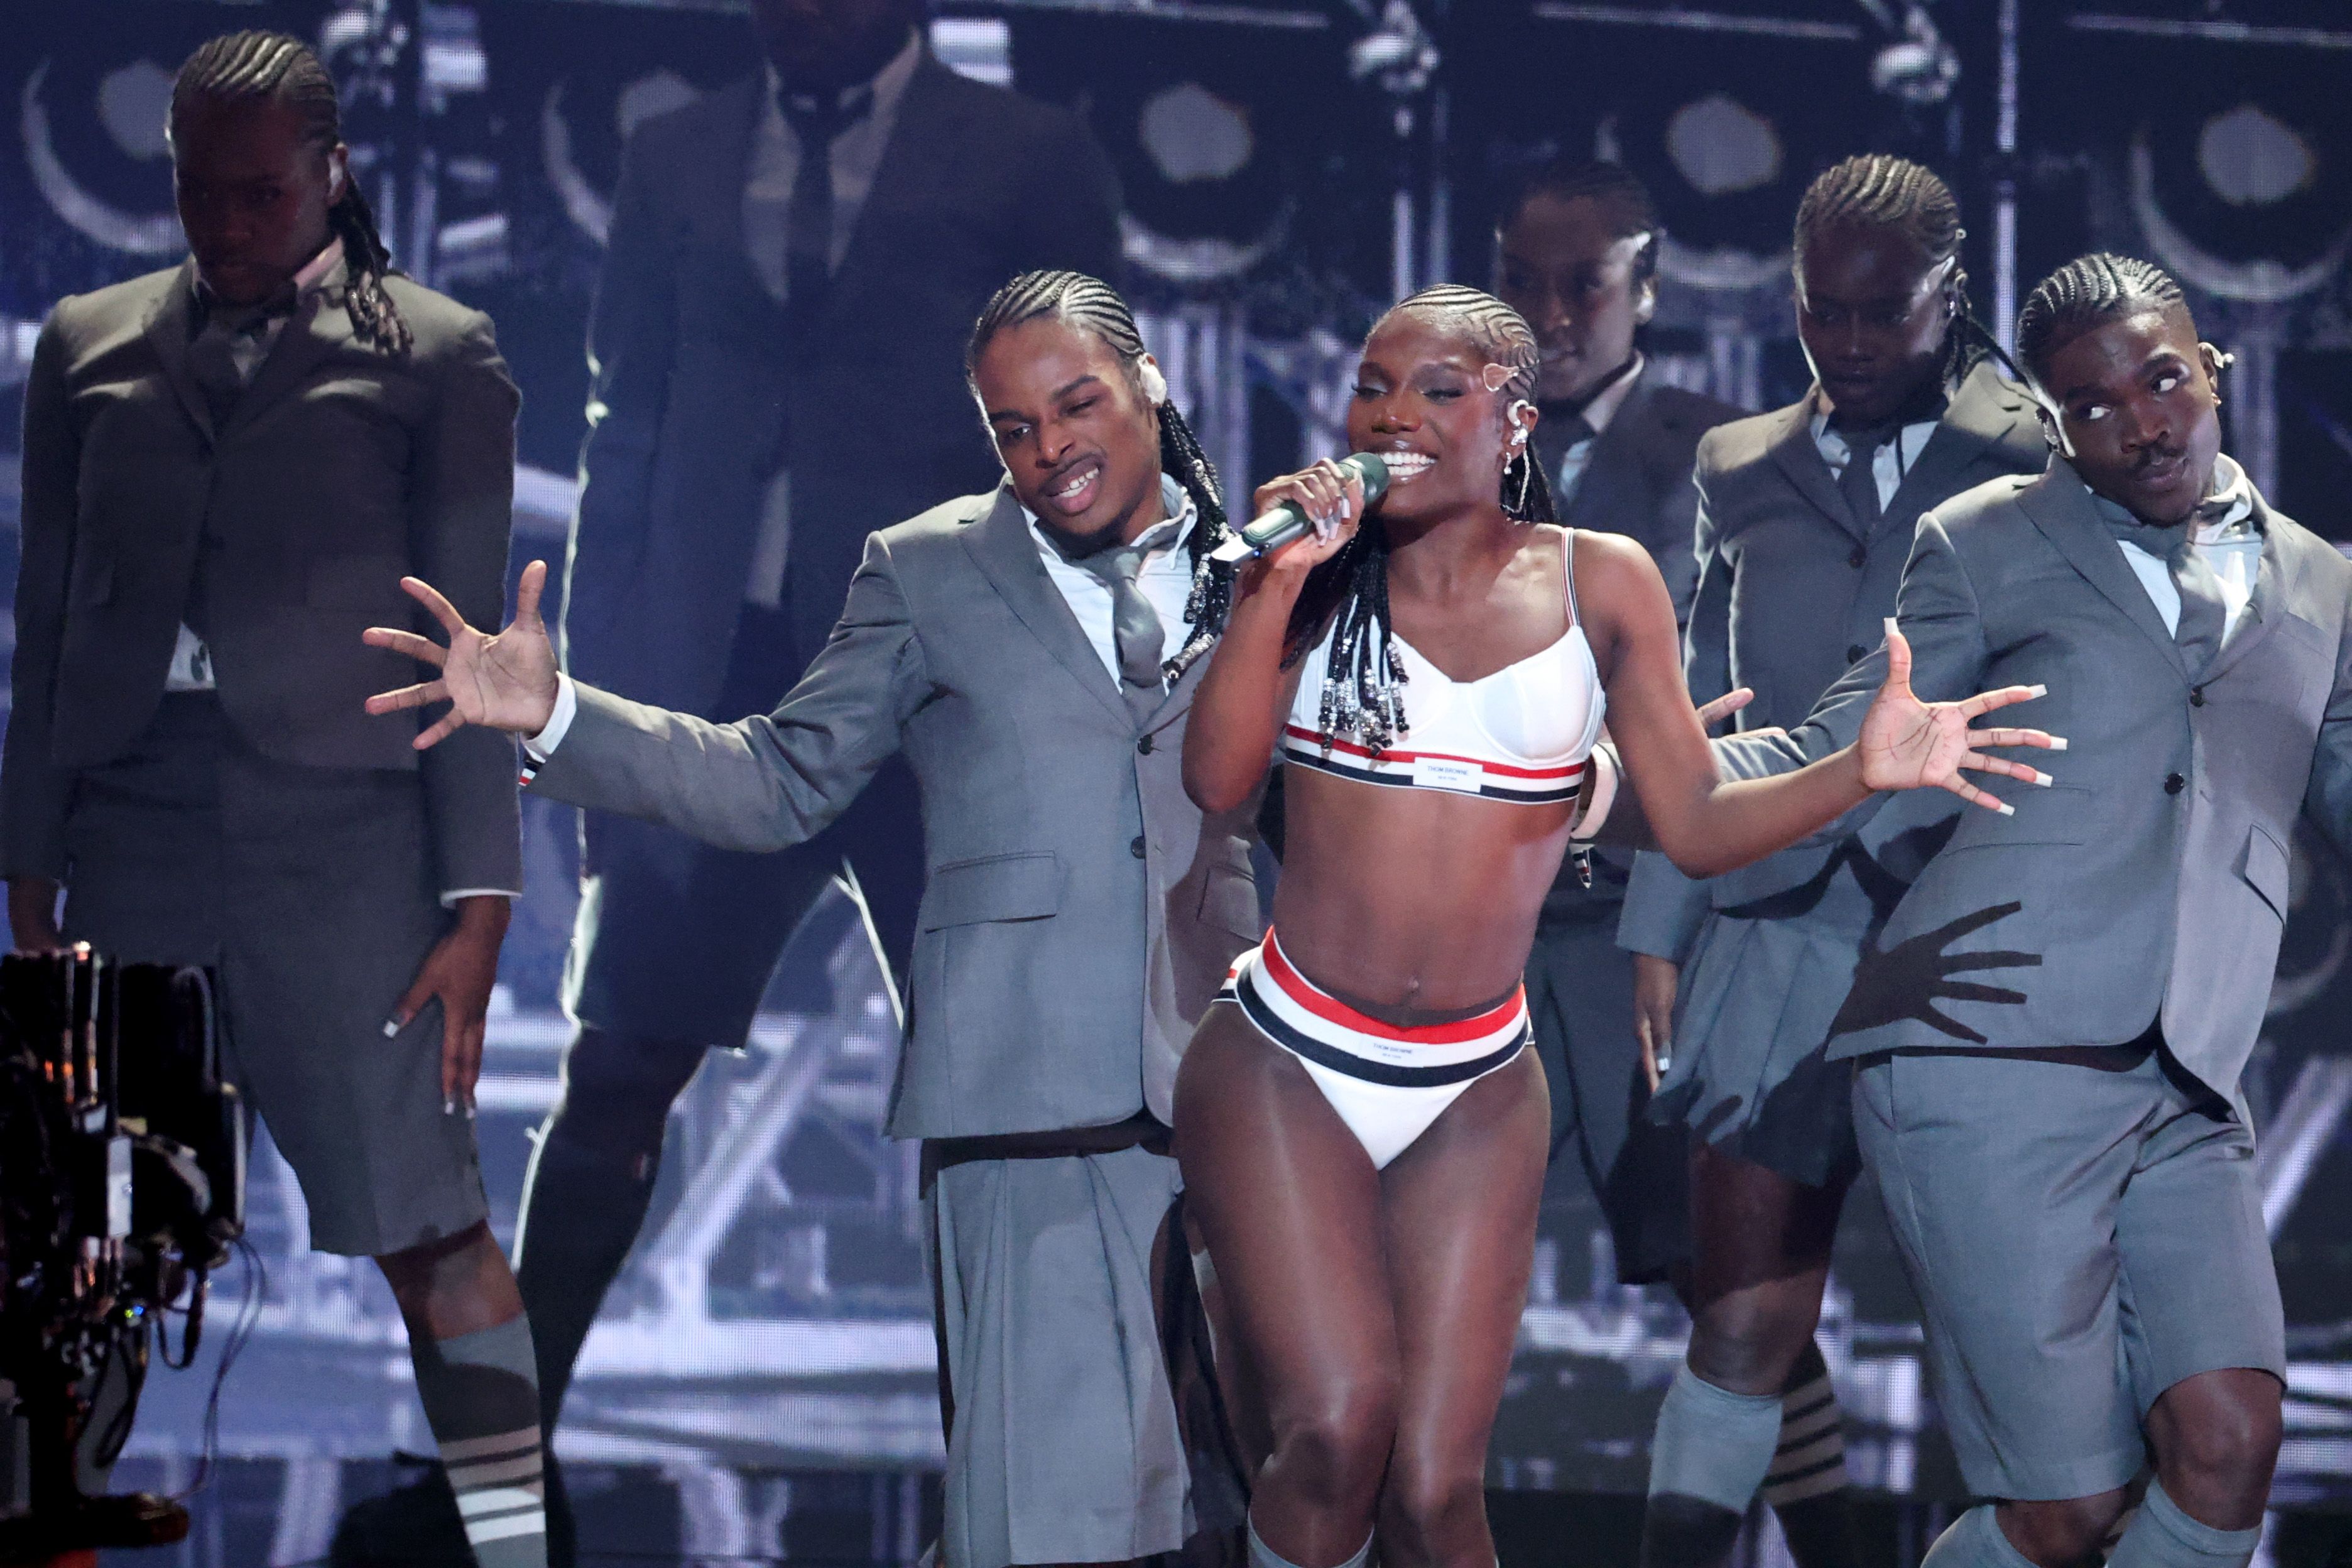
Our data shows TikTok isn't just a platform—it's a launchpad. Through case studies of Doechii and Chappell Roan, we reveal how TikTok virality fuels streaming surges and chart success, particularly for songs with specific traits like high tempo, relatability, and brevity. This project explores a key question: Is virality the new record deal—or does the industry still tip the scales toward the mainstream?
Hey, I’m VibeBot 👾
Explore the artists behind the viral TikTok sounds
American singer-songwriter who rose to fame after her theatrical, queer-positive pop songs found a passionate audience on TikTok. Known for her drag-inspired visuals and emotional lyrics about relationships and identity, Roan became a breakout star of the "lesbian pop renaissance."
American rapper and singer who first caught major attention when her sharp, genre-blending songs took off on TikTok. Blending hip-hop, pop, and R&B with a bold, experimental flair, she quickly built a reputation as a fearless new voice in alternative rap.
Comparing streaming metrics and chart performance
Days between peak TikTok engagement and Billboard chart entry. Each point is a song.
Percentage increase in weekly streams after TikTok virality for the top 10 boosted songs.
Shows the relationship between TikTok buzz and industry push. Larger bubbles mean bigger stream growth.
Tracks Chappell Roan's weekly Spotify streams against the number of new TikTok videos using her sounds.
Compares estimated age distribution of Chappell Roan's audience across major platforms.
Tracks Doechii's 'Anxiety' weekly Spotify streams against new TikTok videos using the sound.
Illustrates how traditional industry events like the Grammys significantly boost not only streaming (Spotify) but also engagement on video platforms (YouTube), complementing viral trends.
Key findings from our analysis
Placeholder Paragraph
Research materials and references
This Kaggle dataset and notebook provided foundational Spotify song data, including track features, artist information, and popularity metrics. It was used to understand song characteristics and establish a baseline of music metadata for correlation with TikTok virality.
A core dataset that supplied lists of songs achieving virality on TikTok, along with associated artists and trending dates. This was crucial for identifying specific tracks for our analysis and tracking their journey across other platforms.
This dataset complemented the primary TikTok trending tracks data by providing additional metrics such as video creation counts, view statistics, or trend durations. It contributed to building a more comprehensive picture of TikTok engagement for viral songs.
A music data analytics platform used to gather comprehensive performance metrics for TikTok viral songs. This provided official chart positions (e.g., Billboard), streaming numbers on major platforms, and radio airplay, which quantified their broader industry impact.
Utilized alongside Soundcharts, Chartmetric provided cross-platform music analytics, offering granular insights into social media statistics, streaming performance, playlist reach, and crucially, audience demographics for artists like Chappell Roan and Doechii.
Served as a reference for songs officially recognized on the TikTok Billboard Top 50 chart. This validated our selection of case study songs and allowed cross-referencing of chart entry dates and peak positions with data from other analytics platforms.
TikTok's official platform for trends and insights. It was used to identify emerging viral sounds, understand the nature of content associated with these sounds (e.g., specific dances, challenges), and gather qualitative data on how songs were being utilized by creators on the platform. This informed the definition of 'primary trend types.'
Consulted to understand the types of data available directly from Spotify, such as track audio features, popularity scores, and artist information. While not directly queried for the frontend, it informed our understanding of data fields like 'spotify_weekly_streams' found in our datasets, which originated from this API.
A music data analytics app providing real-time statistics. It was used similarly to Soundcharts and Chartmetric to track song and artist performance, offering quicker updates or different data slices on streaming, playlisting, and social engagement.
A music data website that provides various music-related statistics, including iTunes, Spotify, YouTube, and radio charts. It's useful for tracking artist performance and song popularity across different platforms and regions.
Select a dataset to view its contents in a table.
Understanding our data sources and processes
Our project utilizes a Supabase PostgreSQL database to store and manage collected data. The data is organized into several tables, each corresponding to specific aspects of our analysis, such as TikTok virality metrics, artist performance data, and demographic information.
Visualizations and data tables are populated by fetching data from Supabase. Our data.php
backend script acts as an intermediary, constructing dynamic SELECT
queries with ordering, filtering, and column selection from tables like tiktok_viral_songs
and chappell_roan_weekly_metrics
to provide data for charts and tables.
The data was acquired from various sources, including Kaggle datasets, music analytics platforms like Chartmetric and Soundcharts, and official resources like the TikTok Creative Center and Spotify API documentation (as detailed in our Sources section).
To populate our Supabase database, we developed Python scripts. These scripts were responsible for:
Our narrative traces the trajectory of musical artists by meticulously connecting diverse data streams. We specifically examine how bursts of viral activity on platforms like TikTok—quantified by metrics such as daily video creation counts and view trends for specific sounds—translate into tangible career milestones. This includes correlating these social media spikes with subsequent surges in weekly Spotify streaming numbers and entries or climbs on official music charts, such as the Billboard Hot 100. Beyond general virality, we track artist-specific weekly performance indicators and audience demographics across different platforms to understand sustained growth and fan engagement. Furthermore, our analysis extends to quantifying the impact of significant industry events, like award nominations or festival headliners, by comparing streaming and engagement data before and after these occurrences to measure their 'bump' effect. By synthesizing these quantitative insights, we aim to construct a compelling, data-driven story of how artists navigate the modern music landscape and achieve success. The granular datasets underpinning this narrative, detailing these metrics, are fully accessible via our raw data explorer.